Project Management Diagram Family
Project management diagrams with 13 node types including tasks, milestones, Gantt bars, resources, risks, and critical path visualization.
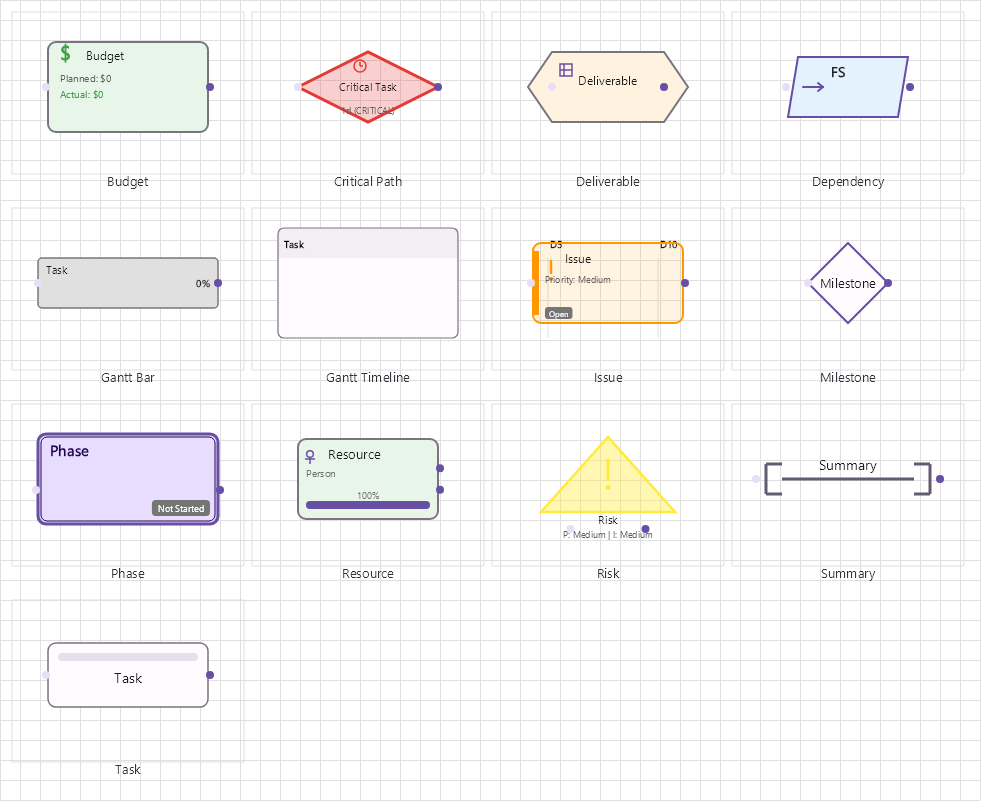
Overview
Base Control: PMControl : MaterialControl
Namespace: Beep.Skia.PM
The PMControl is the root control for this diagram family. It inherits MaterialControl and provides shared port management, styling, and template methods for all nodes in the family.
This family contains 12 node types.
Node Types
| Node Class | Shape | Description |
|---|---|---|
TaskNode | Rectangle with bars | Work task with duration, start/end dates, completion %. |
MilestoneNode | Diamond | Key milestone with target date. |
PhaseNode | Rounded rectangle | Project phase grouping tasks. |
SummaryNode | Black bar/rectangle | Summary task aggregating child tasks. |
DependencyNode | Arrow/diamond | Task dependency (FS, FF, SS, SF). |
GanttBarNode | Horizontal bar | Visual Gantt chart bar representing task duration. |
ResourceNode | Person/resource icon | Team member or resource with allocation %. |
BudgetNode | Dollar/metric rectangle | Budget/cost tracking with planned vs actual. |
CriticalPathNode | Red-highlighted path | Critical path indicator for longest dependency chain. |
DeliverableNode | Package/box icon | Project deliverable with acceptance criteria. |
IssueNode | Warning triangle | Issue/bug tracker with severity and status. |
RiskNode | Risk matrix rectangle | Risk with probability, impact, and mitigation plan. |
TaskNode
Work task with duration, start/end dates, completion %.
| Shape | Rectangle with bars |
|---|---|
| Input Ports | 1 (left) |
| Output Ports | 1 (right) |
MilestoneNode
Key milestone with target date.
| Shape | Diamond |
|---|---|
| Input Ports | 1+ |
| Output Ports | 1+ |
PhaseNode
Project phase grouping tasks.
| Shape | Rounded rectangle |
|---|---|
| Input Ports | 1 |
| Output Ports | 1 |
SummaryNode
Summary task aggregating child tasks.
| Shape | Black bar/rectangle |
|---|---|
| Input Ports | 1 |
| Output Ports | 1 |
DependencyNode
Task dependency (FS, FF, SS, SF).
| Shape | Arrow/diamond |
|---|---|
| Input Ports | 1 |
| Output Ports | 1 |
GanttBarNode
Visual Gantt chart bar representing task duration.
| Shape | Horizontal bar |
|---|---|
| Input Ports | 0 |
| Output Ports | 0 |
ResourceNode
Team member or resource with allocation %.
| Shape | Person/resource icon |
|---|---|
| Input Ports | 1 |
| Output Ports | 1 |
BudgetNode
Budget/cost tracking with planned vs actual.
| Shape | Dollar/metric rectangle |
|---|---|
| Input Ports | 1 |
| Output Ports | 1 |
CriticalPathNode
Critical path indicator for longest dependency chain.
| Shape | Red-highlighted path |
|---|---|
| Input Ports | 1 |
| Output Ports | 1 |
DeliverableNode
Project deliverable with acceptance criteria.
| Shape | Package/box icon |
|---|---|
| Input Ports | 1 |
| Output Ports | 1 |
IssueNode
Issue/bug tracker with severity and status.
| Shape | Warning triangle |
|---|---|
| Input Ports | 1 |
| Output Ports | 1 |
RiskNode
Risk with probability, impact, and mitigation plan.
| Shape | Risk matrix rectangle |
|---|---|
| Input Ports | 1 |
| Output Ports | 1 |
Connection Points
Every node in this family exposes connection points (ports) for linking to other nodes. Port positions are computed lazily by LayoutPorts(), which runs when MarkPortsDirty() flags the layout as stale after a move or resize.
| Node Class | Input Ports | Output Ports | Extra |
|---|---|---|---|
TaskNode | 1 (left) | 1 (right) | — |
MilestoneNode | 1+ | 1+ | — |
PhaseNode | 1 | 1 | — |
SummaryNode | 1 | 1 | — |
DependencyNode | 1 | 1 | — |
GanttBarNode | 0 | 0 | — |
ResourceNode | 1 | 1 | — |
BudgetNode | 1 | 1 | — |
CriticalPathNode | 1 | 1 | — |
DeliverableNode | 1 | 1 | — |
IssueNode | 1 | 1 | — |
RiskNode | 1 | 1 | — |
Connection Conventions
When building diagrams with this family, follow these conventions:
- Task dependencies follow standard FS/FF/SS/SF notation
- Gantt bars are time-scaled horizontally
- Critical path is highlighted in red/orange
- Milestones typically connect to preceding tasks
Usage Example
Complete example showing creation, node placement, and connection:
C# Example
var pm = new PMControl
{
    X = 50, Y = 50,
    Width = 700, Height = 400
};
drawingManager.AddComponent(pm);

var task = new TaskNode
{
    X = 150, Y = 100,
    Text = "Implement Login",
    Duration = TimeSpan.FromDays(5)
};
var milestone = new MilestoneNode
{
    X = 400, Y = 100,
    Text = "M1: Alpha Release",
    Date = DateTime.Now.AddDays(30)
};
var dep = new DependencyNode
{
    X = 300, Y = 100,
    DependencyType = "FS" // Finish-to-Start
};

drawingManager.AddComponent(task);
drawingManager.AddComponent(milestone);
drawingManager.AddComponent(dep);

drawingManager.ConnectComponents(task.OutPoints[0], dep.InPoints[0]);
drawingManager.ConnectComponents(dep.OutPoints[0], milestone.InPoints[0]);