Quantitative/Financial Diagram Family
Quantitative finance and trading diagrams with time series, technical indicators, statistical nodes, and strategy visualization.
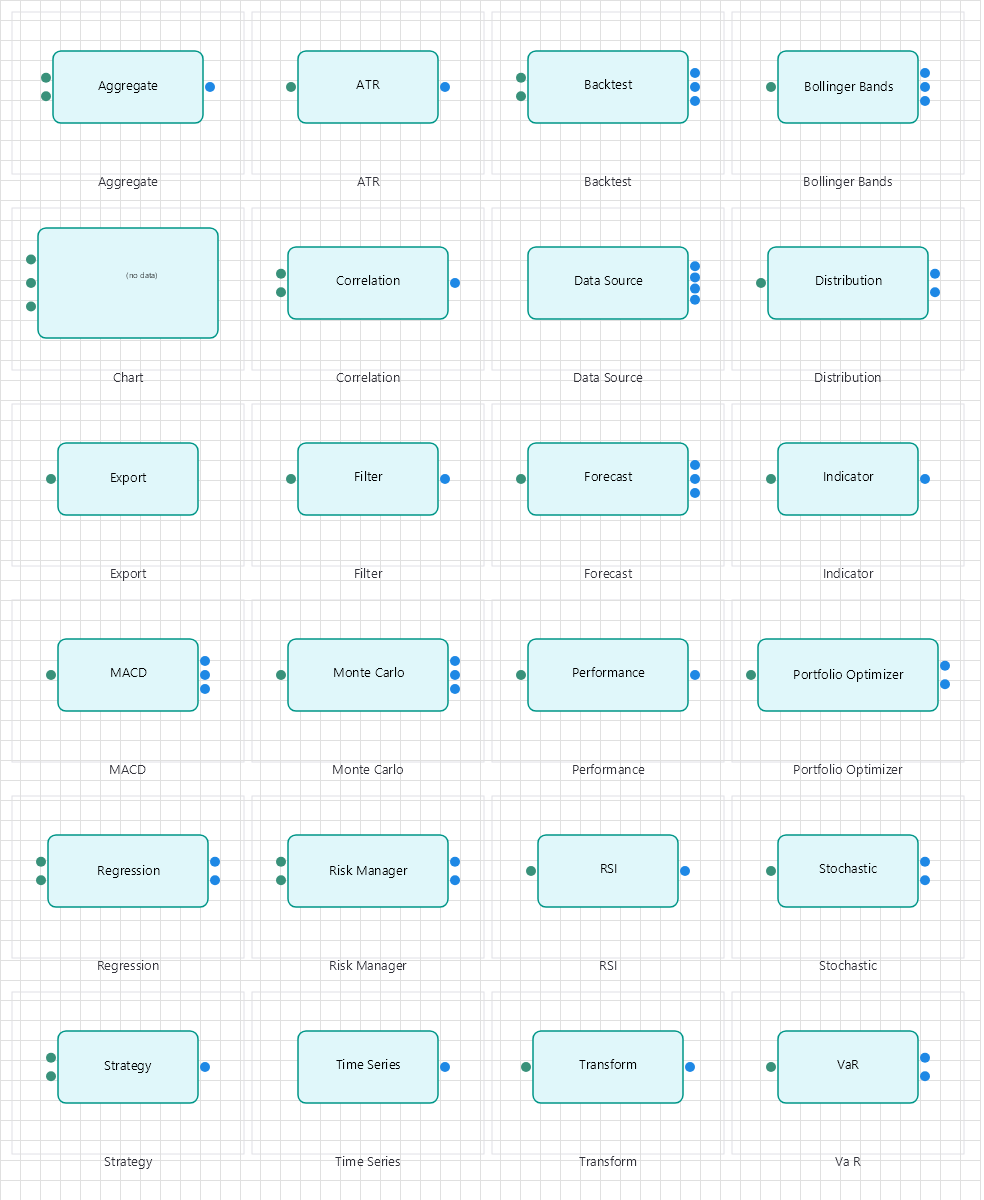
Overview
Base Control: QuantControl : MaterialControl
Namespace: Beep.Ski.Quantitative
The QuantControl is the root control for this diagram family. It inherits MaterialControl and provides shared port management, styling, and template methods for all nodes in the family.
This family contains 6 node types.
Node Types
| Node Class | Shape | Description |
|---|---|---|
TimeSeriesNode | Chart/candlestick | OHLCV time series with symbol, interval, and date range. |
IndicatorNode | Indicator panel | Technical indicator: SMA, EMA, RSI, MACD, Bollinger, Stochastic. |
DataNodes | Data block | Input/transformed data including fundamentals and alternative data. |
IndicatorNodes | Multi-indicator | Composite indicator combining multiple signals. |
StatisticalNodes | Statistics icon | Statistical analysis: correlation, regression, distribution tests. |
StrategyNodes | Strategy cog/icon | Trading strategy with entry/exit rules and position sizing. |
TimeSeriesNode
OHLCV time series with symbol, interval, and date range.
| Shape | Chart/candlestick |
|---|---|
| Input Ports | 0 |
| Output Ports | 1+ |
IndicatorNode
Technical indicator: SMA, EMA, RSI, MACD, Bollinger, Stochastic.
| Shape | Indicator panel |
|---|---|
| Input Ports | 1 |
| Output Ports | 1 |
DataNodes
Input/transformed data including fundamentals and alternative data.
| Shape | Data block |
|---|---|
| Input Ports | 1 |
| Output Ports | 1 |
IndicatorNodes
Composite indicator combining multiple signals.
| Shape | Multi-indicator |
|---|---|
| Input Ports | 2+ |
| Output Ports | 1 |
StatisticalNodes
Statistical analysis: correlation, regression, distribution tests.
| Shape | Statistics icon |
|---|---|
| Input Ports | 1+ |
| Output Ports | 1 |
StrategyNodes
Trading strategy with entry/exit rules and position sizing.
| Shape | Strategy cog/icon |
|---|---|
| Input Ports | 2+ |
| Output Ports | 1 |
Connection Points
Every node in this family exposes connection points (ports) for linking to other nodes. Port positions are computed lazily by LayoutPorts(), which runs when MarkPortsDirty() flags the layout as stale after a move or resize.
| Node Class | Input Ports | Output Ports | Extra |
|---|---|---|---|
TimeSeriesNode | 0 | 1+ | — |
IndicatorNode | 1 | 1 | — |
DataNodes | 1 | 1 | — |
IndicatorNodes | 2+ | 1 | — |
StatisticalNodes | 1+ | 1 | — |
StrategyNodes | 2+ | 1 | — |
Connection Conventions
When building diagrams with this family, follow these conventions:
- TimeSeries is always the data source (no inputs)
- Indicators chain left-to-right from data to strategy
- Strategies may output to backtesting or execution nodes
Usage Example
Complete example showing creation, node placement, and connection:
C# Example
var quant = new QuantControl
{
    X = 50, Y = 50,
    Width = 700, Height = 500
};
drawingManager.AddComponent(quant);

var ts = new TimeSeriesNode
{
    X = 100, Y = 150,
    Symbol = "AAPL",
    Interval = "1d"
};
var sma = new IndicatorNode
{
    X = 280, Y = 150,
    IndicatorType = "SMA",
    Period = 20
};
var strategy = new StrategyNode
{
    X = 460, Y = 150,
    StrategyType = "MovingAverageCrossover"
};

drawingManager.AddComponent(ts);
drawingManager.AddComponent(sma);
drawingManager.AddComponent(strategy);

drawingManager.ConnectComponents(ts.OutPoints[0], sma.InPoints[0]);
drawingManager.ConnectComponents(sma.OutPoints[0], strategy.InPoints[0]);