Welcome
This guide explains what the well views show, how to read them, and how your administrator adapts them to your company, country and data sources - without changing software.
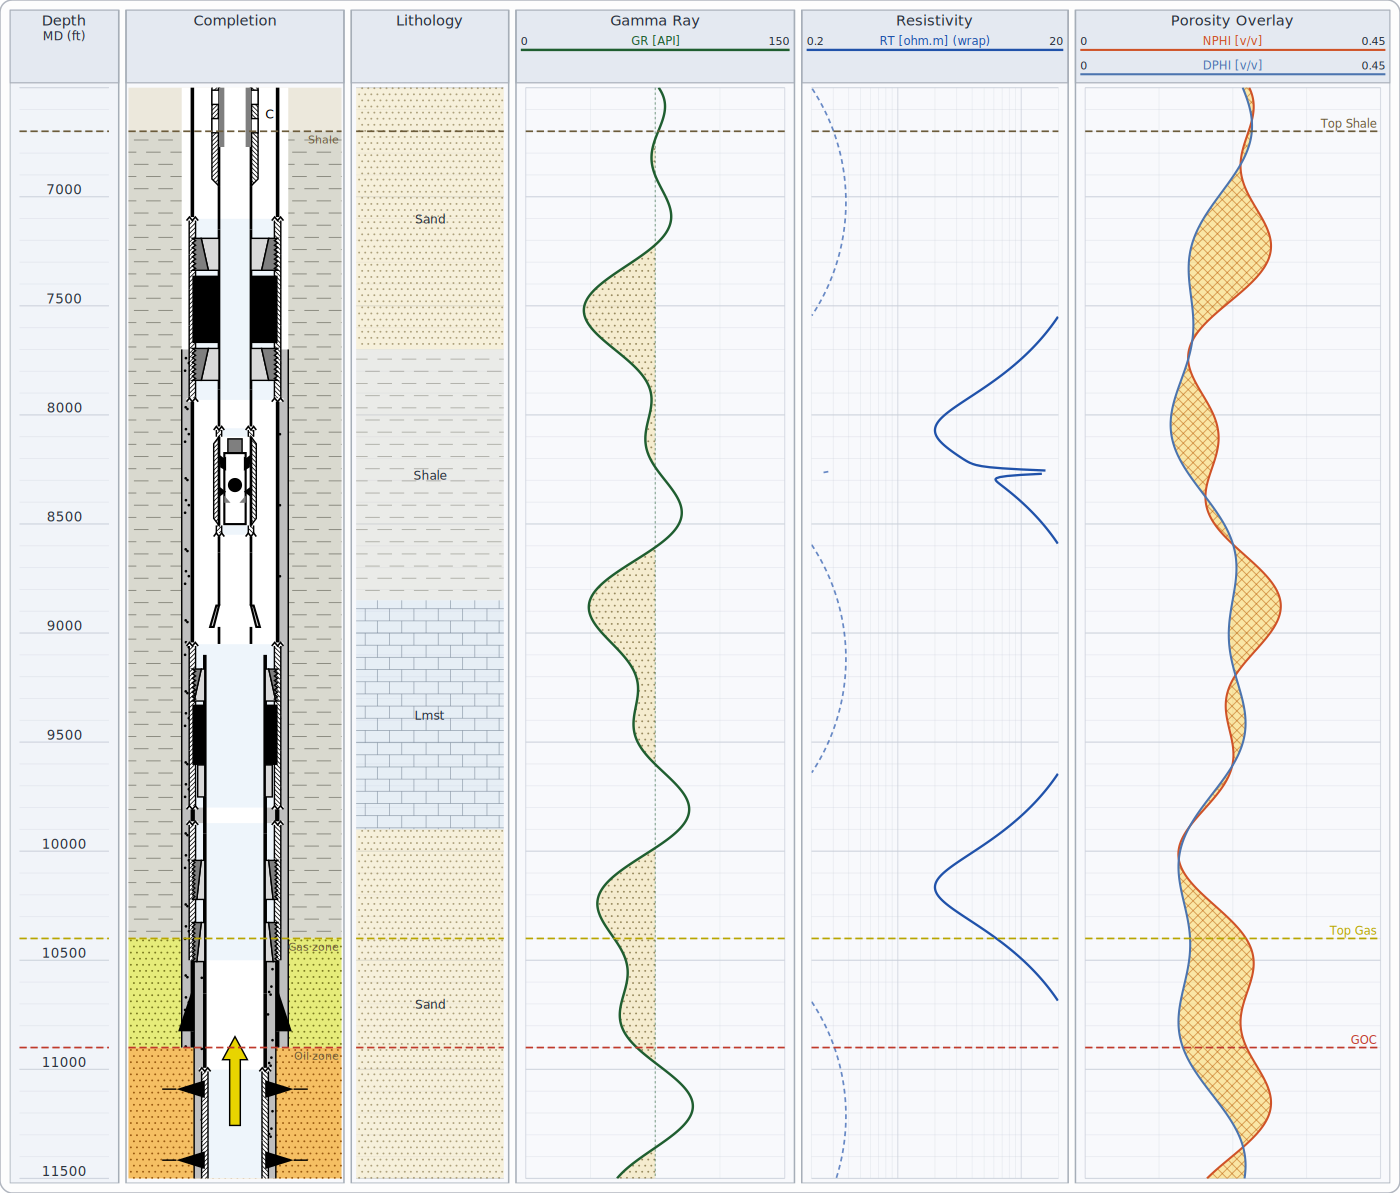
What you can see
| View | Shows |
|---|---|
| Completion schematic | Casing, liners, tubing, cement, hole sizes and equipment at depth, with the equipment tally and casing program |
| Well logs | Curves, lithology, cutoff shading, core data, dips, borehole images, cement bond (CBL / VDL), mud log |
| Well integrity | Primary / secondary barrier envelopes, leak paths, annuli and MAASP screening, planned vs as built |
| Correlation & cross-section | Several wells side by side or on a map line, tops joined as surfaces, flattening |
| Well path | The completion drawn along the real trajectory (build, hold, horizontal) |
| Formation pressure | Pressure tests, gradient lines, fluid types and free-fluid levels |
| Live data | Logs growing while drilling, with a LIVE / STALE indicator |
How this guide is organised
- Reading the views - what every colour, line and label means.
- Configuring your environment - one file adapts units, criteria, names and colours to your company.
- Setting up a company - the data manager's guide: data sources, coverage, code values, equipment, stratigraphy, lithology, logs, verification.
- Bringing in your data - LAS, WITSML, CSV, PPDM and your own databases; codes and layer names.
- Methods, standards & assumptions - how each number is calculated and what it assumes.
- Mapping toolbox - gridding, contour maps and 3D views of well data (in progress).
- Training toolbox - exercises as data files on the well views, scoring, courses, results exports and five sample courses.
- Data and AI toolbox - legacy document extraction and well identity reconciliation - proposals a person confirms - and OSDU ingestion (dry run by default).
- Production and reservoir toolbox - Arps decline curve analysis, fitting and EUR.
- Drilling engineering toolbox - well planning (exact target landing), soft-string torque and drag, hydraulics and ECD, drilling performance (time-depth, NPT).
- Well integrity toolbox - caliper wall loss per joint, corroded joints re-rated, annular casing pressure (MAWOP, diagnostic tests), well integrity categories and the field board.
- Exports: LAS 3.0, OSDU and WITSML 2.1 - LAS 3.0 to the CWLS specification; OSDU and WITSML 2.1 valid against their official schemas.
- Field QC and mapping suggestions - every well of a source checked at once; proposed mappings for unresolved values.
- Casing design checks - API burst, collapse and tension ratings and design factors per string.
- Anti-collision - separation factor, MASD and the ladder and travelling-cylinder plots (ISCWSA rule).
- Pay summary and log editing - net pay per zone with your cutoffs; depth shifts and splices with audit and undo.
- Validation messages - what each check means and what to do.
- Glossary and Questions & answers.